
1. What is a Population?
A population is a group of individuals of the same species living in a well-defined geographical area, sharing resources and potentially interbreeding.
Examples:
- Cormorants in a wetland
- Rats in an abandoned house
- Teak trees in a forest
- Bacteria in a culture plate
- Lotus plants in a pond
Important: Even organisms reproducing asexually can be considered a population in ecological studies.
2. Population Ecology
Population ecology connects:
Ecology ↔ Population Genetics ↔ Evolution
Natural selection operates at the population level, although individual organisms experience environmental changes.
3. Population Attributes
An individual organism does not have population attributes, but a population does.
| Population Attribute | Meaning |
|---|---|
| Birth rate (Natality) | Rate of addition of new individuals |
| Death rate (Mortality) | Rate of loss of individuals |
| Sex ratio | Proportion of males and females |
| Age distribution | Distribution of individuals among different age groups |
| Population density (N) | Number/measure of individuals in a given area or volume |
4. Birth Rate
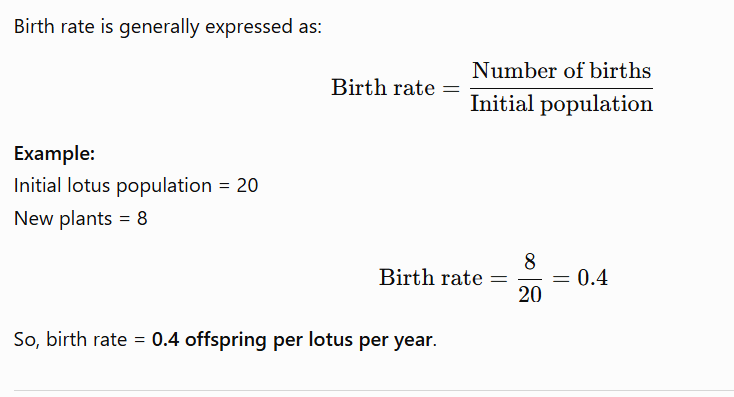
So, birth rate = 0.4 offspring per lotus per year.
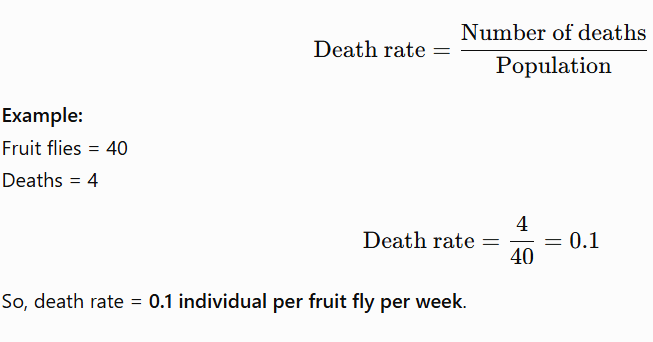
5. Death Rate
6. Sex Ratio
It represents the proportion of males and females in a population.
Example:
60% females + 40% males
An individual is either male or female, but a population has a sex ratio.
7. Age Distribution & Age Pyramid
A population contains individuals of different ages.
The graphical representation of the age distribution is called an age pyramid.
The shape indicates whether the population is:
(a) Expanding / Growing
➡️ Large proportion of pre-reproductive individuals
(b) Stable
➡️ Relatively similar proportion of pre-reproductive and reproductive groups
(c) Declining
➡️ Smaller proportion of pre-reproductive individuals
NEET point: Age pyramid reflects the growth status of a population.
8. Population Size / Population Density
Population size is technically called population density, represented by:N
It is not always expressed simply as the total number of organisms.
Different ways to measure population density:
1. Number
- Appropriate when individuals can be counted easily.
2. Biomass
- Useful when organisms differ greatly in size.
3. Percentage cover
- Useful for plants with large canopies.
4. Relative density
- Used when absolute counting is difficult.
Examples
Banyan vs Parthenium:
Suppose:
- Parthenium = 200 plants
- Banyan = 1 large tree
Simply saying banyan has a lower density based on number can be misleading because one banyan may occupy a huge area and have a major ecological role.
Therefore, percentage cover or biomass may be more meaningful.
Bacteria in a Petri Dish
When bacterial population is extremely large and direct counting is difficult, biomass or other indirect measures can be used.
Fish Population
Instead of counting every fish in a lake:
Number of fish caught per trap
can be used as a measure of relative density.
9. Population Density May Be Estimated Indirectly
In many cases, organisms are not actually counted or directly observed.
Tiger Census
Tiger population is often estimated using indirect evidence such as:
- Pug marks
- Fecal pellets
Thus, population size can be estimated indirectly.
NEET/JEE One-Liners
- Population density is represented by → N
- Population has birth rate and death rate; individual has births and deaths.
- Sex ratio is a population attribute.
- Age pyramid represents → age distribution of a population.
- Age pyramid indicates → growth status of population.
- Growing population → more pre-reproductive individuals.
- Population density need not always be measured by number.
- Biomass/percentage cover can be used to estimate population density.
- Fish caught per trap → relative density.
- Tiger census → indirect estimation using pug marks and fecal pellets.
- Population ecology links ecology with population genetics and evolution.
- Natural selection operates at the population level.
Files, images, and data analysis are unavailable until usage resets at 6:12 PM. Continue chatting with text only, or upgrade for more access.Upgrade to Plus

